FLUX OPENING NIGHT

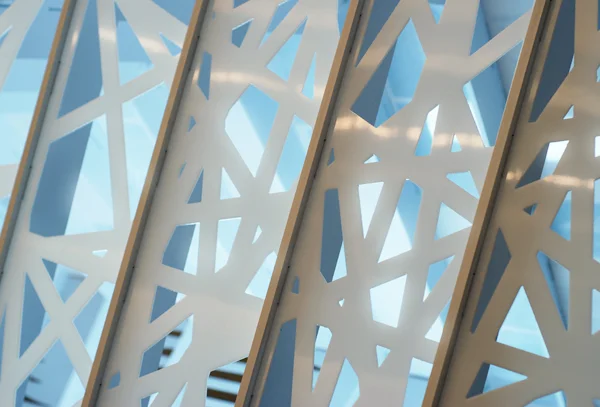
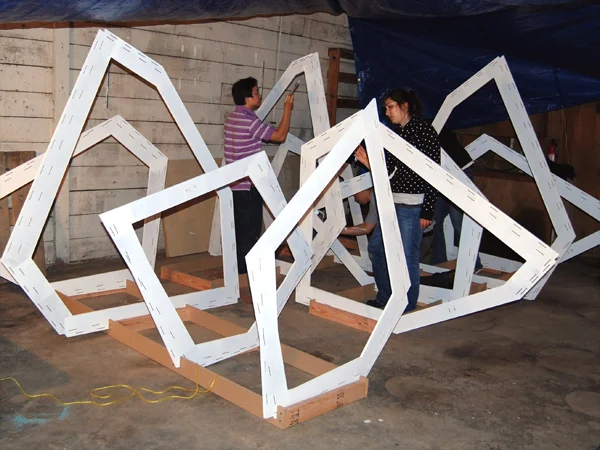
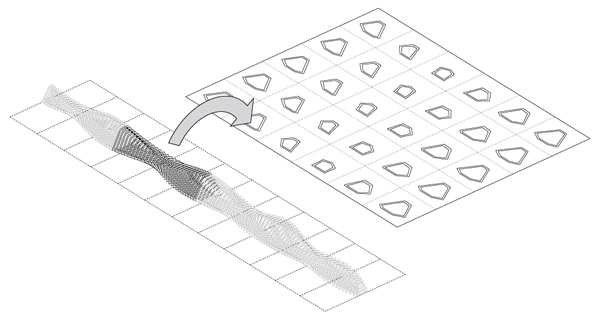
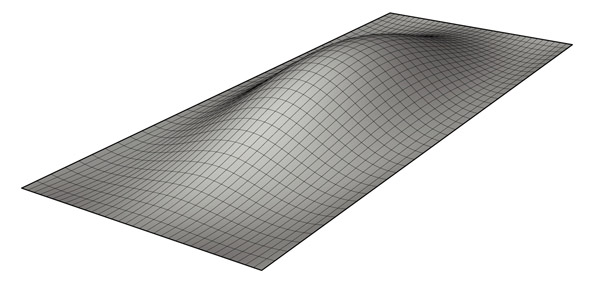
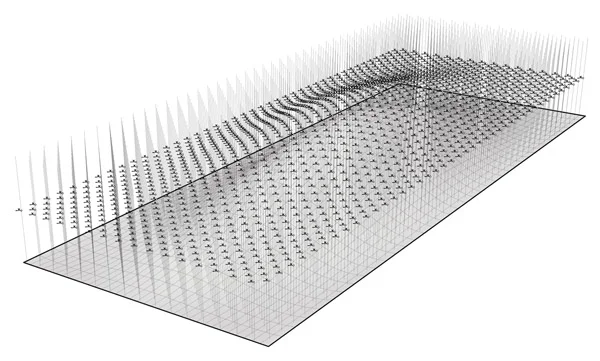
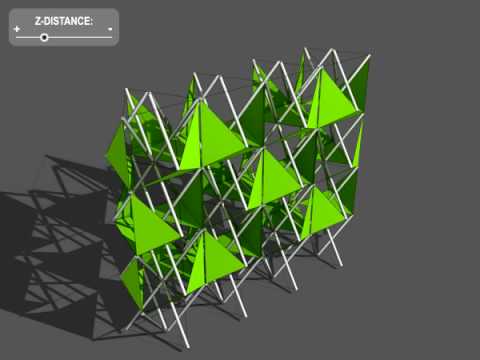
The FLUX exhibition opened last night at the California College of Arts and we had an incredible turnout.  The exhibition explores contemporary architecture and design through its relationship with changes in design technologies such as parametric modeling, digital fabrication, and scripting.  Over 40 projects are featured in the exhibition through drawings, photographs, and specially made models that explore the techniques and processes presented in the projects.  Eight topics dealing with the geometric and performative aspects of the projects are explored: Stacked Aggregates, Modular Assemblages, Pixelated FieldsCellular Clusters, Serial Iterations, Woven Meshes, Material Systems,Emergent Environments.  I was brought in as a parametric modeling and complex geometry consultant to write a Grasshopper definition that would generate the form, ribs, plexi-glass panels, and all of the connection details.  These would in turn be flattened in Rhino so they could be sent directly to the CNC mill.  Final fabrication started just 2 weeks before the opening and because all of the details had been controlled in the parametric model, each of the 4 modules could be constructed in just two and half hours.     

Director of Architecture, CCA: Ila Berman
Project Design and Fabrication: Kory Bieg, Andre Caradec, Andrew Kudless
Parametric Design Consultant: Andy Payne
Sponsors: K Bieg DesignStudio Under Manufacture, Solid Thinking

Photos courtesy of Kory Bieg 

fluxexhibition_09.jpg
fluxexhibition_23.jpg
fluxexhibition_08.jpg
FLUX_photo_01_small.jpg
fluxexhibition_11.jpg
fluxexhibition_24.jpg
fluxexhibition_13.jpg
fluxexhibition_14.jpg
FLUX_photo_02_small.jpg
fluxexhibition_22.jpg

FLUX FABRICATION

Below are some of the in-progress shots for the FLUX Exhibition which will open on March 30th at 8:30pm at the San Francisco campus of the California College of the Arts. The school is located at 1111 Eighth Street, San Francisco, CA.

Director of Architecture, CCA: Ila Berman
Project Design and Fabrication: Kory Bieg, Andre Caradec, Andrew Kudless
Parametric Design Consultant: Andy Payne
Sponsors: K Bieg DesignStudio Under Manufacture, Solid Thinking

Photos courtesy of Kory Bieg 

Flux_web_01.jpg
Flux_web_01.jpg
flux_11.jpg
Flux_web_02.jpg
Flux_web_03.jpg
Flux_web_04.jpg
Flux_web_05.jpg

FLUX PARAMETRICS

The following are a series of diagrams that help explain the parametric process I used for the FLUX Exhibition which opens in San Francisco on Monday, March 30th.  The entire project was completed using the Grasshopper plugin for Rhino and was used to create all of the flattened information - such as the rib outlines, the plexiglass panels, and all corresponding connection details - which was then sent directly to the CNC mill for fabrication. 

STEP 1: A series of points, pre-definied in three dimensional space, are referenced into the parametric software. The points can be controlled by a set of sliders that allow translation along any of the orthographic axes, ultimately driving the…

STEP 1: A series of points, pre-definied in three dimensional space, are referenced into the parametric software. The points can be controlled by a set of sliders that allow translation along any of the orthographic axes, ultimately driving the shape of each interpolated curve that passes through the control points.

STEP 2: A set of planes are created at 10½” O.C. along the full length of the curve network. The distance between each plane, which controls the spacing between each rib, can be updated by changing a numeric slider.

STEP 2: A set of planes are created at 10½” O.C. along the full length of the curve network. The distance between each plane, which controls the spacing between each rib, can be updated by changing a numeric slider.

STEP 3: Because some of the interpolated lines in the curve network do not run the full length of the nave, but instead branch off of the two main lines, the topology of the curves would yeild an unloftable surface. However, the software can so…

STEP 3: Because some of the interpolated lines in the curve network do not run the full length of the nave, but instead branch off of the two main lines, the topology of the curves would yeild an unloftable surface. However, the software can solve the intersection between a plane and a curve which results in a point. A line can be created between each new intersection point to form the outlines of each rib.

STEP 4: The outside rib curves are offset 4” to create the inside of each rib curve. The ribs are then split into four modules for easier installation.

STEP 4: The outside rib curves are offset 4” to create the inside of each rib curve. The ribs are then split into four modules for easier installation.

STEP 5: Each rib set is then re-oriented to the XY plane to facilitate the CNC milling process.

STEP 5: Each rib set is then re-oriented to the XY plane to facilitate the CNC milling process.

STEP 6: Once the rib curves have been flattened, the outlines can be offset and subdivided to create a series of notches in the ribs and the corresponding tabs on each side of the plexiglass panels. The software evaluates the length of each pie…

STEP 6: Once the rib curves have been flattened, the outlines can be offset and subdivided to create a series of notches in the ribs and the corresponding tabs on each side of the plexiglass panels. The software evaluates the length of each piece of plexiglass and determines the number of subdivisions on each side, so that longer panels have more tabs and thus more support than smaller pieces.

STEP 7: A detail view of a flattened rib and the corresponding pleixglass panels. The perforations that occur in some of the panels are created in Rhinoscript and are coordinated with one of the eight architectural topics represented in the exh…

STEP 7: A detail view of a flattened rib and the corresponding pleixglass panels. The perforations that occur in some of the panels are created in Rhinoscript and are coordinated with one of the eight architectural topics represented in the exhibition.

A screenshot of the final definition used to create the entire FLUX exhibition. Click to enlarge.

SLOW FOOD NATION PARAMETRICS

I finally finished the script for the exhibition space we have designed where we suspend 3024 mason jar lids from a T-bar ceiling.  In order to streamline the process, I used the Grasshopper plug-in to parametrically control several aspects of the design.  Below, I try to explain each step of the process and how the script works.  This script is much more detailed than the previous version, as now all of the steps are embedded into 2 scripts: one grasshopper definition which deals with all of the math behind the project, and one rhinoscript that deals with exporting the data to Microsoft Excel for easy access.  

Step 1: The script needs a surface that is larger than the point grid area in order to function properly, so the first step is to generate a sufrace using any of Rhino's surface creation methods. This is the only step that is required prior to launc…

Step 1: The script needs a surface that is larger than the point grid area in order to function properly, so the first step is to generate a sufrace using any of Rhino's surface creation methods. This is the only step that is required prior to launching Grasshopper and running the definition. Click image for more detail.

Step 2: The first part of the definition creates a staggered point grid based on a variable offset distance (inches) which is parametrically driven by an integer slider labeled "point spacing". It is important that the point grid is created above th…

Step 2: The first part of the definition creates a staggered point grid based on a variable offset distance (inches) which is parametrically driven by an integer slider labeled "point spacing". It is important that the point grid is created above the surface (z-axis). Click image for more detail.

Step 3: The next part of the definition duplicates the staggered point grid created in Step 2 and moves them along the z-axis so that the copies are below the given surface. Next, a vertical line is created between the original point grid and the du…

Step 3: The next part of the definition duplicates the staggered point grid created in Step 2 and moves them along the z-axis so that the copies are below the given surface. Next, a vertical line is created between the original point grid and the duplicates. Click image for more detail.

Step 4: The definition uses a surface-curve intersection event to create a new point at the location where the vertical lines created in Step 3 intersect the surface. A new line is then created from the new intersection points and the original point…

Step 4: The definition uses a surface-curve intersection event to create a new point at the location where the vertical lines created in Step 3 intersect the surface. A new line is then created from the new intersection points and the original point grid created in Step 2. Click image for more detail.

Step 5: The script then uses a few components and functions to create a label that defines what panel the vertical line will be attached to, what lid will be attached to the vertical line, and the length of each line. A text tag is placed at the mid…

Step 5: The script then uses a few components and functions to create a label that defines what panel the vertical line will be attached to, what lid will be attached to the vertical line, and the length of each line. A text tag is placed at the midpoint of each line similar to: "Panel1_Lid1 72.000". The distance is measured in inches and rounds the length of the line to the nearest one thousandth. All text tags must be baked into the scene in order to export the data to excel. (special thanks to Troy Zezula for collaborating on this part of the script). Click image for more detail.

Step 6: Once all of the text tags have been baked into the scene, use the "Load Script" command and locate the rhinoscript called "Export_curvedata_excel.rvb". The use the "Run Script" command and select the loaded rhinoscript from the menu. Follow …

Step 6: Once all of the text tags have been baked into the scene, use the "Load Script" command and locate the rhinoscript called "Export_curvedata_excel.rvb". The use the "Run Script" command and select the loaded rhinoscript from the menu. Follow the on screen directions in the command prompt and select all of the text tags. Excel will automatically open, and a new file will be created with the panel labels and lengths organized for easy access. Within Excel you can convert the length stored from Rhino (rounded to the nearest one thousandth) into a more managable dimension using feet and inches and a specified tolerance. Click image for more detail.